Amazon product co-purchasing network
Perform Principal Component Analysis?
Principal Component Analysis PCA, is a good technique for dimensionality reduction. What variables are relevant and its meaning could be extracted from the analysis.
What PCA does is to capture most of the variance in a dataset by grouping variables into a single component. From each component we would try to determine if there is any sense, and then create new parameters or select some of them. The first steps into PCA should include two tests for significance: homogeneity of variances and correlation test.
As we are trying to extract significant variables( to predict, classify or describe a phenomena) from a set of parameters of which we may have different distributions we perform the first test. To that end we use The Bartlett Sphericity Test. We would test the hypothesis that the variances for each variable is that they do not have significant different variances.
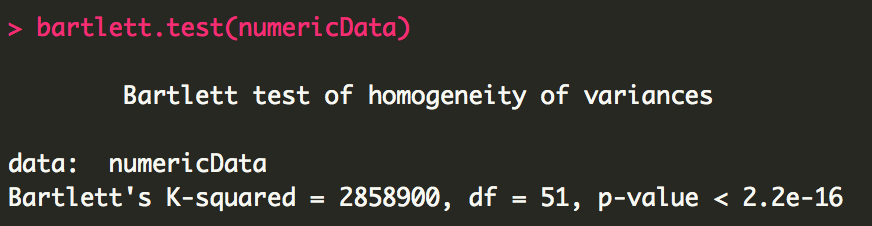
To perform the Bartlett Test in R we use the function called bartlett.test(numericData) form the library stats. A positive result for PCA is when a low p-value is shown; meaning that the variances in our variables are not significantly different, even with different distributions for each parameter.
In the example shown to the right, we have our green light to perform Principal Component Analysis. What is the p-value cutoff? Well as usual it depends on the significance level (alpha) you are looking for. For this given example even a 99% confidence (alpha 0.01) would make the cut.
In the example shown to the right, we have our green light to perform Principal Component Analysis. What is the p-value cutoff? Well as usual it depends on the significance level (alpha) you are looking for. For this given example even a 99% confidence (alpha 0.01) would make the cut.
– Take a brief pause to say that our intention is to prepare posts in a colloquial practical way, rather than a technical one. Thus we considere a methodology, such as PCA, as a tool just as R is a tool to perform PCA. We are trying to show how we may approach an analysis; showing how a tool is or not helpful giving the output provided by the tools –
Related posts


